Sound selection
I found that the visualisation of the water waves was better at fixed sound frequencies, and that each sound has a dominant frequency, and the pattern at this frequency is representative for that sound. So I decided to use the shape of the water waves at the main frequency of each sound as a lens for the image of each of these sounding objects.
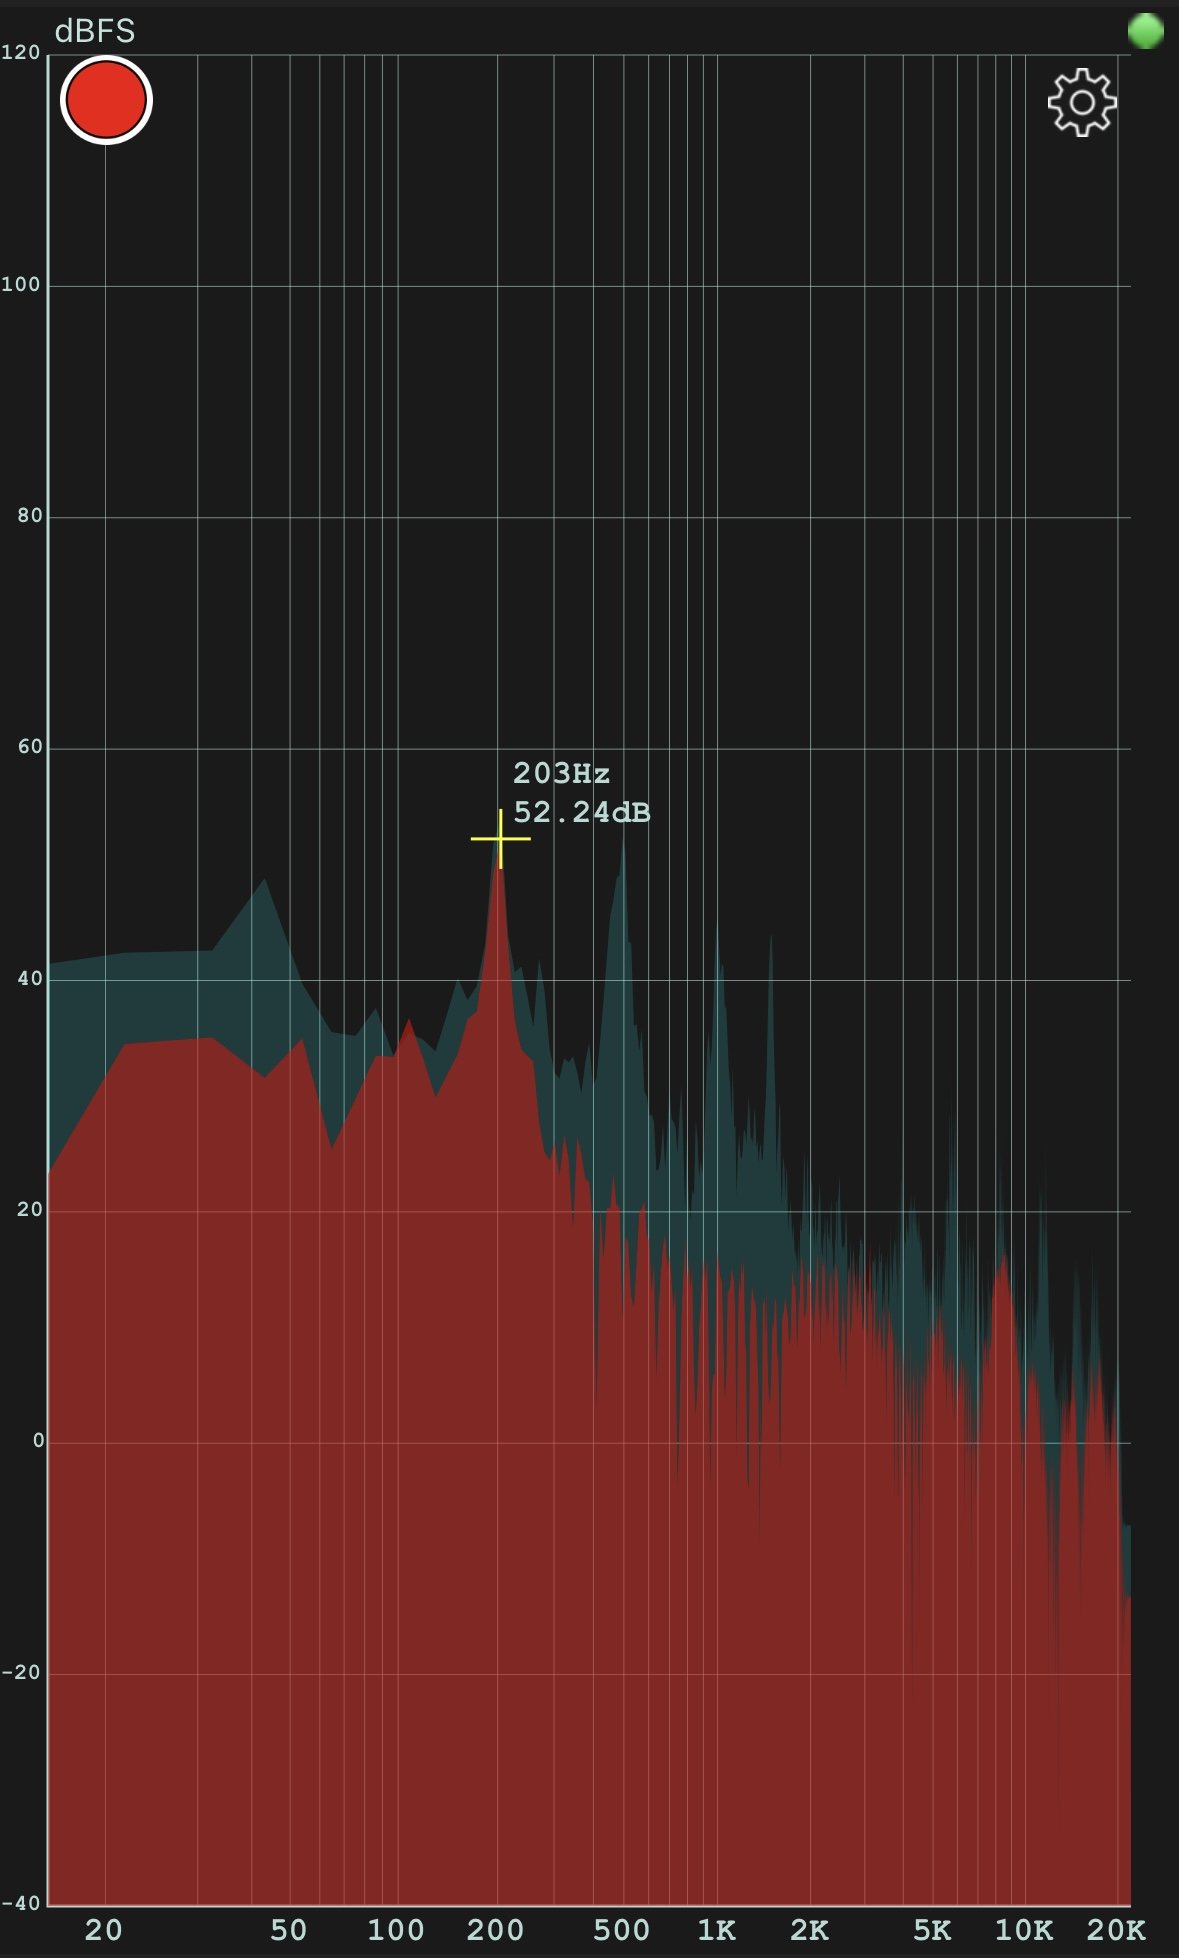
I collected the sounds from the interview results and measured them through a frequency analyser. (The major frequency peak of a sound is usually the highest peak in the spectrogram. The frequency corresponding to that peak is the primary frequency of the sound, which is the Hertz value of the sound.) I found that a lot of the sounds that people hate the most are in the frequency range between 40 and 300hz, where the visual effect of water waves would be better. And in the course of the interviews I conducted, there were also respondents who said they would find it interesting to see a display of the sounds they detested. So I chose a few representative disgusting sounds for sound visualisation.


1.Deep-sea sound (42HZ)
2.Footsteps (56HZ)
3.Knocking (86HZ)
4.Thunder (161HZ)
5.Car horns (203HZ)
6.Drill Noise (211HZ)
7.Baby crying (248HZ)